Analytics
Overview Tab
The analytics overview allows you to select a timeframe to see service data within those selected dates.
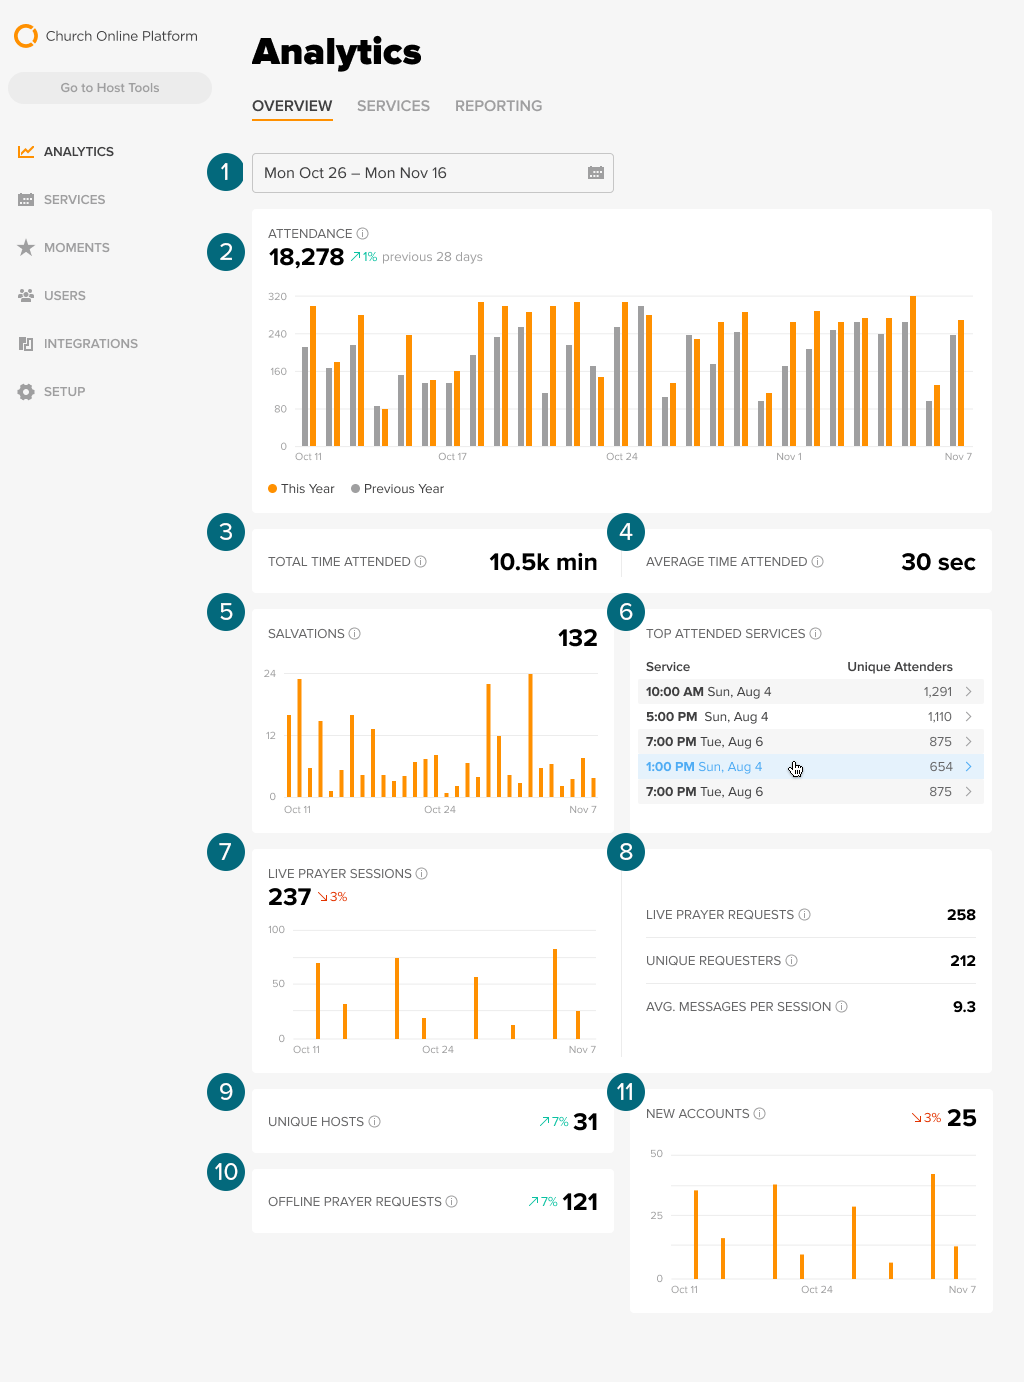
- Date Picker: select the timeframe you would like to view data from.
- Attendance: the number of unique web browsers that loaded the page during a service during the selected timeframe.
- Total Time Attended: the sum of time attended by all attenders across all services during the selected timeframe.
- Average Time Attended: the average time each person attended across all services during the selected timeframe.
- Salvations: the number of attenders who clicked the salvation moment across all services during the selected timeframe.
- Top Attended Services: services with the highest number of attenders during the selected timeframe.
- Live Prayer Sessions: the number of live prayer sessions between a host and a guest during the selected timeframe.
- Live Prayer Requests: the number of prayer requests received during the selected timeframe.
- Unique Requesters: the number of unique attenders who requested live prayer during the selected timeframe.
- Average Message Per Session: the average number of messages per live prayer session during the selected timeframe.
- Unique Hosts: the total number of unique hosts at all services during the selected timeframe.
- Offline Prayer Requests: the number of non-live prayer requests received during the selected timeframe.
- New Accounts: the number of users who have signed up for an account during the selected timeframe.
If you are unable to view analytics from the previous year in the graph, you can view all services one by one in the services tab.
Services Tab
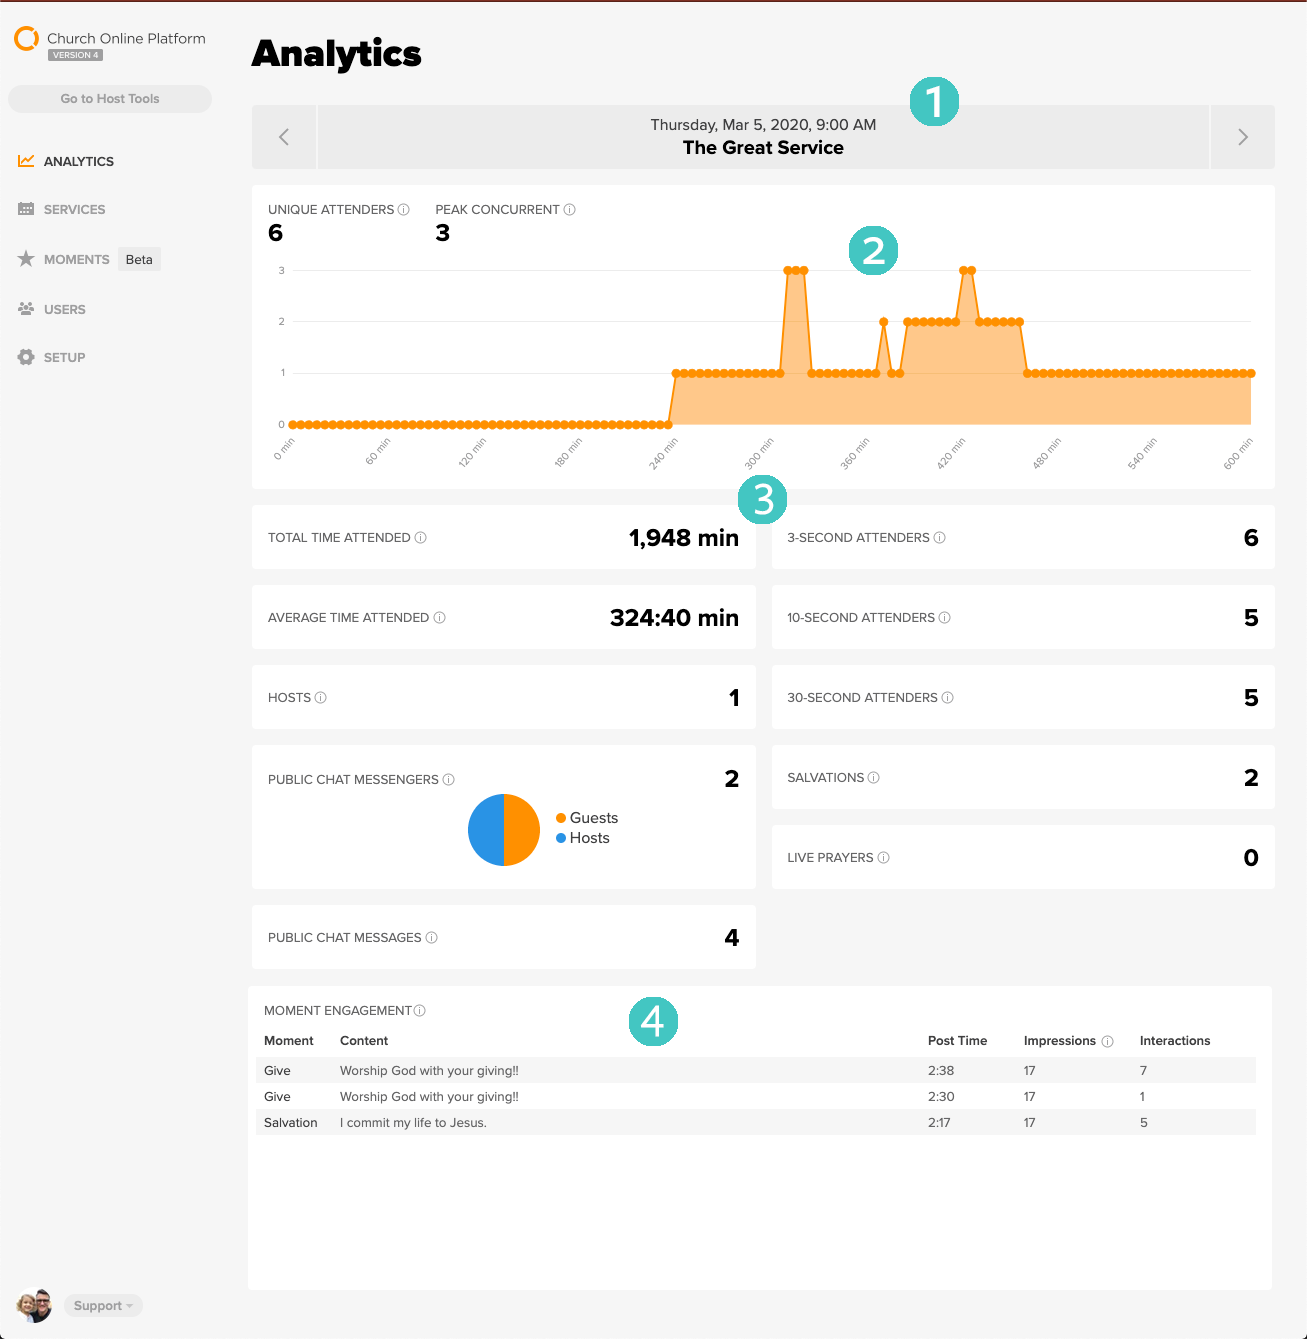
- Service Information: displays Service Information such as date, time, and title. A user can toggle between services utilizing the arrows. Or you can click on the title of the service; a calendar will appear and you will choose the date/time of the service you wish to view analytics from.
- Graph
- Unique Viewers: the amount of unique web browsers that have at least loaded the page for this Service.
- Peak Concurrent: the highest amount of concurrent attenders during this Service.
- Graph: shows how many people were represented within the service at any specific time. Ex: there were around 15 people within the above service at the 30 minute mark.
- Service Data
- Total Time Attended: the sum of all attenders’ time spent on your site during this Service.
- Average Time Attended: the average of all attenders’ time spent on your site during this Service.
- Hosts: the amount of hosts who were at the Service for longer than 1 minute.
- Public Chat Messengers: the amount of unique attenders and hosts who posted at least one message in the Public chat feed.
- Public Chat Messages: the total amount of chat messages posted in the Public chat feed during this Service.
- 3-second Attenders: the amount of unique attenders who were present for at least 3 seconds during this Service.
- 10-second Attenders: the amount of unique attenders who were present for at least 10 seconds during this Service.
- 30-second Attenders: the amount of unique attenders who were present for at least 30 seconds during this Service.
- Salvations: the total number of times the Salvation Moment was interacted with during this Service. Attenders cannot tap the button more than once per time the Moment is posted.
- Live Prayers: the amount of live prayer sessions involving a guest and a host.
- Moments Engagement Data
- Table: displays the Moment Type, the Content of the Moment, the time in the Service when it was posted, the amount of Impressions, and the amount of Interactions.
- Impressions: the amount of web browsers present in the Service at the time the Moment was posted.
- Interactions: the amount of times the Moment button was clicked (e.g. "Give" for the Give Moment and "Raise Hand" for the Salvation Moment).
Having Trouble With Admin Analytics?
Missing Gray Overview Bar:
The graph in the Analytics Overview tab might be missing the gray bar for the previous year's data.
- Workaround: For the current month, you can change the date filter to match the same month in the previous year. Take screenshots of each view to compare results manually. Unfortunately, you can’t change the filter to go back more than the first day of the month a year ago.
Can’t Set The Analytics Filter Back More Than One Year:
Analytics data for services are often available for more than a year, but our summary filter only goes back to the first day of the month of the previous year.
- Workaround: You can still look at service analytics one at a time. Click on the services banner to select a different date picker as shown in step #1 under the Services tab here.
Can't View Analytics For A Service:
The analytics data for some services may be unavailable, especially for some services in late March 2024.
- Workaround: Click on the services banner to select a different date picker as shown in step #1 under the Services tab here.
Duplicate Transcripts or Wrong Transcript Service Titles:
Transcripts might be duplicated or show the wrong service title. This is rare and can be caused by services being changed once the service starts.
- Workaround: Ignore the duplicates or wrong titles; all service data is still there. Sorry for the extra clutter and title areas.